What is going on with the Arizona Real Estate Market?
Check out the charts below to see the overall real estate pricing and inventory activity in the Greater Phoenix Area. Charts are updated weekly, so be sure to check back soon to see the latest data.
Table of Contents
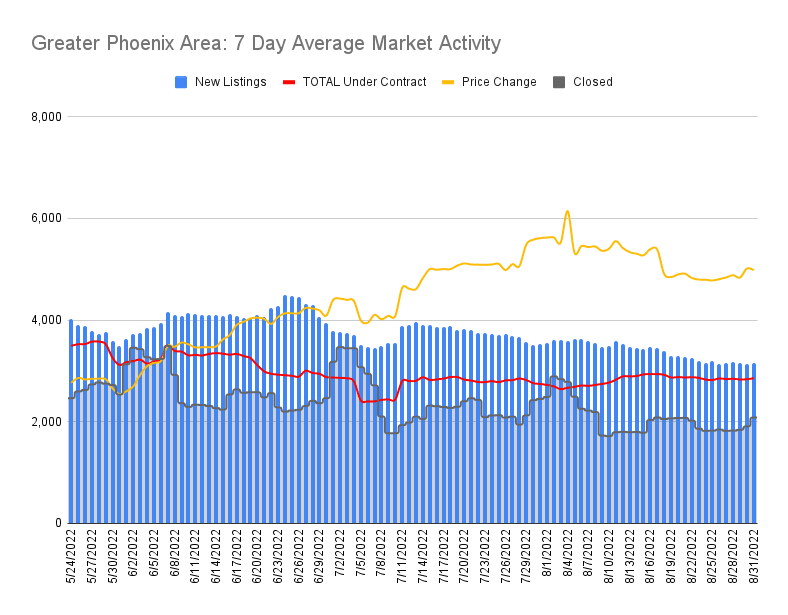
Fewer Homes Listed in the Arizona Real Estate Market
(Data Source: ARMLS 5/24/2022 – 8/31/2022)
The blue bars on this graph indicate the 1-week average of homes listed onto the market. As you can see, this number has been falling overall since late June of 2022. This means that there aren’t a ton of sellers rushing to list their homes in the Arizona Real Estate Market. As of today, August 31, 2022, there were about 3,154 homes listed over the past 7 days.
But home sellers have had to lower their listing prices to attract buyers. The yellow line indicates price changes over the past 7 days. As of today, August 13, 2022, 4,981 seller have had to change their price. This is about 25.6% of the total Active and Coming Soon listings in the overall Greater Phoenix housing market. In other words, about 1 in every 4 homes had a price change in the past 7 days. That’s a lot of price changes.
These price changes seem to mostly be a result of not a lot of homes going under contract. The red line indicates the number of homes going under contract in the past 7 days. As of the writing of this article, it sits at about 2,855 homes that have gone under contract this past week.
The gray area at the bottom of this chart represents home closings over the past 7 days. This has been hovering recently around 2,000 closings over the course of 1 week.
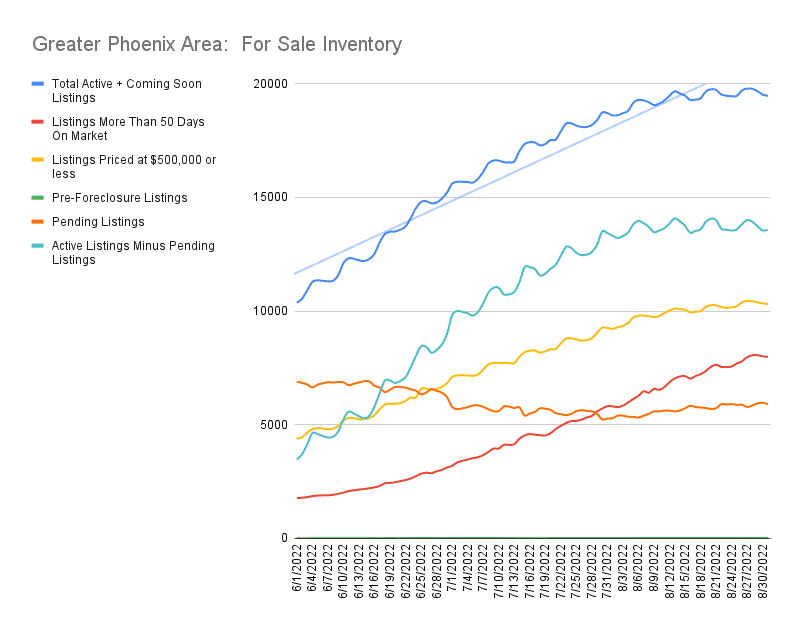
Overall Phoenix Inventory Growth Slowing
(Data Source: ARMLS 6/1/2022 – 8/30/2022)
The amount of homes available for purchase, the blue line on this chart, has grown in Phoenix since June, but that growth is currently slowing down. There were just over 10,000 Active and Coming Soon homes on the market June 1st. That number ballooned to just shy of 20,000 listings by mid-August. But the rate of that growth has slowed.
Meanwhile, the number of homes available priced at $500,000 or less, the yellow line on this chart, has also increased. This is good news for home shoppers as there are now more homes to choose from. But the growth of this price range of homes is starting to slow. Check back often to see if this number will grow further or begin to soften.
The red line on this chart indicates homes that have been on the market for more than 50 days. This number has swelled significantly from around 1,800 homes to about 8,000 recently. This means that it is taking a lot longer for homes to sell. This means that sellers have to be more patient to sell their home and buyers have a little more time to shop around for the house that best suits their needs.
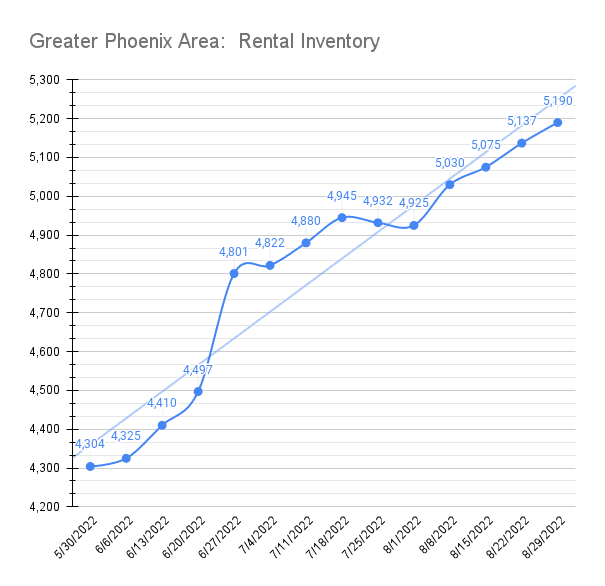
Greater Phoenix Rental Inventory Climbs
(Data Source: ARMLS 5/30/2022 – 8/29/2022)
The number of homes available to rent continues to increase. Renters looking for a rental home will find that there are nearly 900 more rental homes on the market than there were 3 months ago.
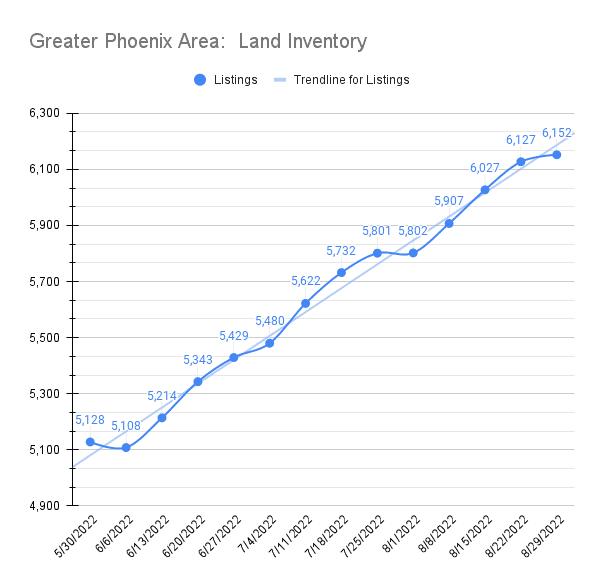
More Building Lots For Sale In Phoenix
(Data Source: ARMLS 5/30/2022 – 8/29/2022)
The number of building lots available in the Greater Phoenix Area has been on the rise. While not dramatic, there are about 1,000 more lots for sale today than there were three months ago.
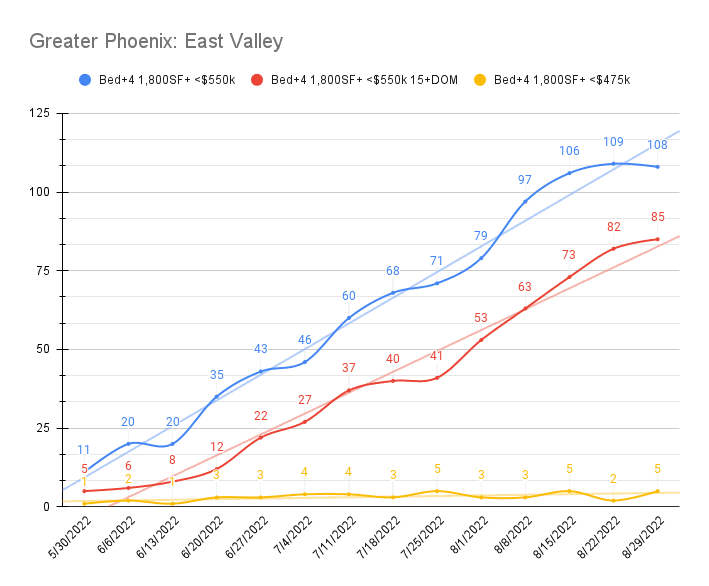
Shopping The Southeast Valley
(Data Source: ARMLS 5/30/2022 – 8/29/2022)
To give a sense of how the latest trends are affecting buyers, this chart looks at a specific home search. This is a buyer looking for homes in the Southeast Valley of Greater Phoenix. They are looking for bedrooms plus of 4, 1,800sf or more and their maximum budget is $550,000.
From the blue line, we can see that back at the end of May, their search would have yielded only 11 results, but today they would have over 100 homes to chose from.
The red line shows how many of these homes have been on the market over 15 days. Back at the end of May only 5 homes had been on the market for two weeks or more, but today that number is around 85.
The yellow line shows the same search requirements as the blue line, but with a maximum budget of $475,000. While the number of homes fitting this max budget has increased, the increase has not been significant.
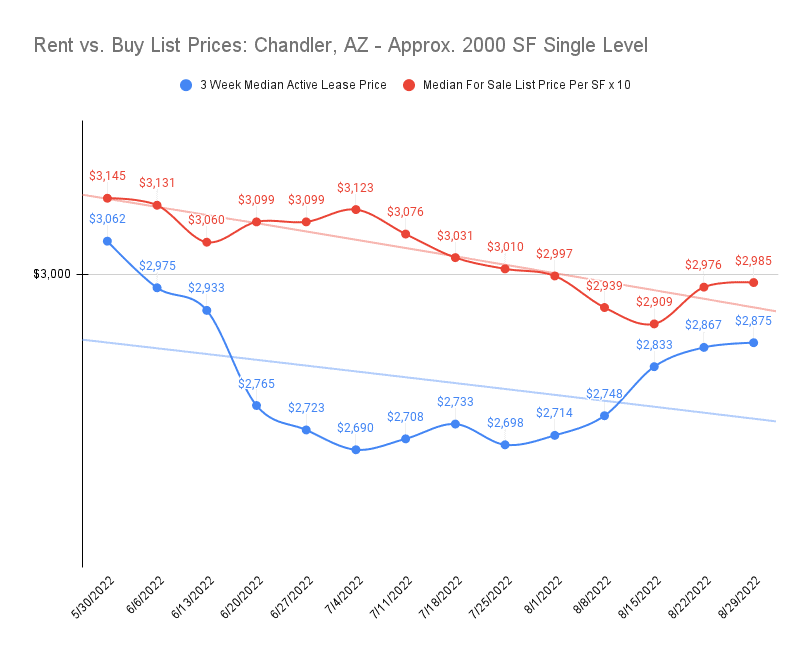
Rent vs. Buy In The Arizona Real Estate Market
(Data Source: ARMLS 5/30/2022 – 8/29/2022)
The blue line is the median active for rent list price for approximately 2,000sf single level homes in Chandler, AZ. The month of June saw this price edge down about 10%. But those price drops have since staged a mild recovery.
To compare the active rent prices to what you can buy, the red line indicates the medial for sale list price of the same type of home multiplied by 10. This index fell about 7.5% in June and July, but has since recovered some of those price declines.
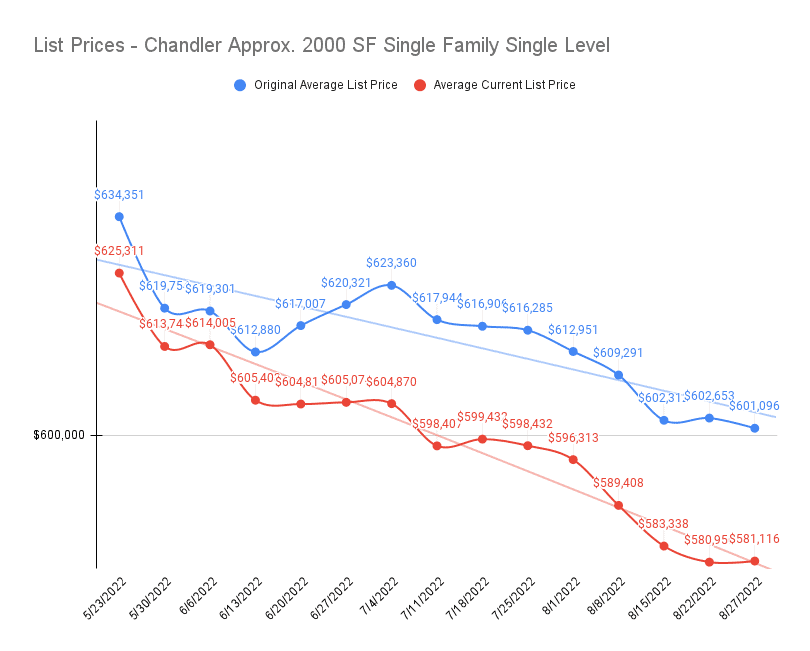
Sellers Asking Less
(Data Source: ARMLS 5/23/2022 – 8/27/2022)
To get a sense of the seller experience, this chart takes a look at asking prices for approximately 2,000sf single level homes in Arizona.
The blue line represents seller’s original average asking price. And the red line shows the average current price. Since May, sellers have had to offer deeper cuts to their list prices. As of this week, sellers have had to take an average haircut of 3.3% off their original asking price. Since late May, sellers have had to drop their price expectations an overall 8.4%.
Arizona Real Estate Market Closed Listings On The Move
There has been a lot of talk about Phoenix home prices on the rise over the past couple of years. And lately, there has been talk of prices on the decline. But is that decline visible in closed listing data?
A closed listing is a home that successfully closed escrow. This is arguably the truest data we have on house prices. That’s because listing prices are what home sellers are hoping to get for their home and may not reflect actual contract price.
The downside to closed listing information is that it shows pricing information for homes that went under contract approximately 30-45 days ago. So it is a bit of a lagging indicator. But it’s a hard number and gives us solid insight into Arizona Real Estate Market.
To get closed listings data, we take a look at closed sales each week from Sunday through Saturday. We update this data each week, so be sure to bookmark this page to check back to see the latest.
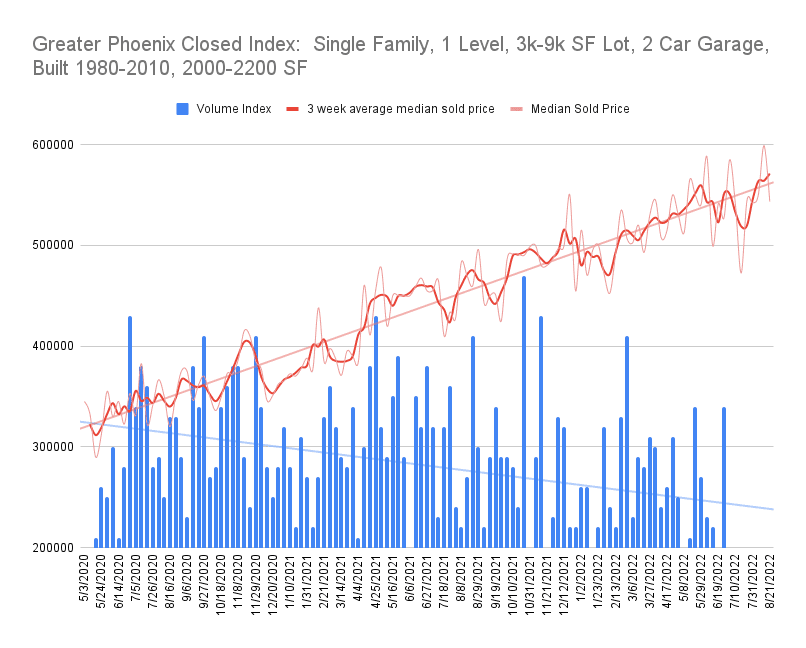
Greater Phoenix Area: Single Level, Single Family
(Data Source: ARMLS 5/3/2020 – 8/21/2022)
This chart takes a look at homes built from 1980 – 2010. This is on purpose to exclude newer builds as well as older homes to give us a sense of the resale market in the Greater Phoenix Area. This chart zeroes in on single level, single family homes with a 2-car garage. This is a popular home configuration in the Phoenix area.
As of today, the closed data shows that this type of home has been increasing in value. In fact, looking at the straight red trend line for median sold price, the overall rate of increase has been on an uptrend since May of 2020.
Listing volume on the other hand, shown in blue, has been on the decline overall since early July of 2020.
Check back next week. This is the chart we are watching closely to see how the bread and butter residential resale market in the Greater Phoenix Area is performing.
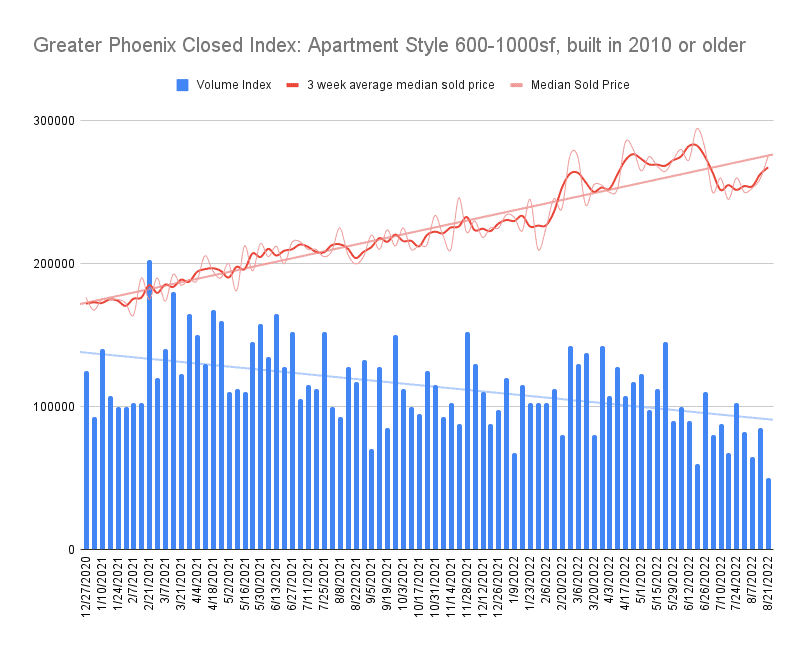
Greater Phoenix Area: Apartment Style
(Data Source: ARMLS 12/27/2020 – 8/21/2022)
The median sold price for apartment-style homes peaked in June at a median price of $294,400.
The median price began to fall after that peak, but has since rallied back to the long-term trend line and this week settled at $275,375.
We will keep a close eye on this chart as apartment-style homes often make market moves before single-family homes.
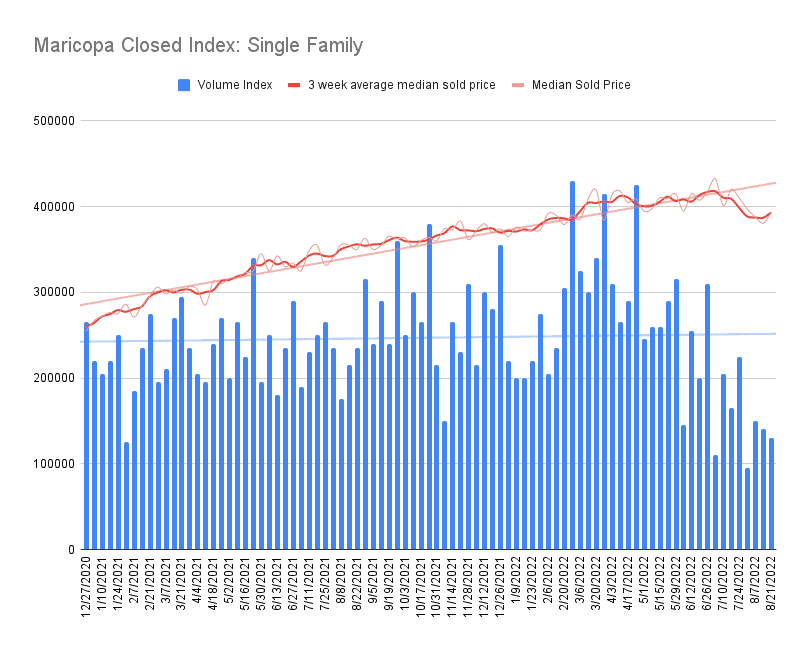
Maricopa, AZ
(Data Source: ARMLS 12/27/2020 – 8/21/2022)
The median home price in Maricopa, AZ has fallen from from its July peak of $432,450 to $393,245.
Maricopa is a city to watch because it has a high volume of single family homes and new-build homes.
Let’s take a look at Arizona Real Estate Market inventory levels in select cities across the Greater Phoenix Area.
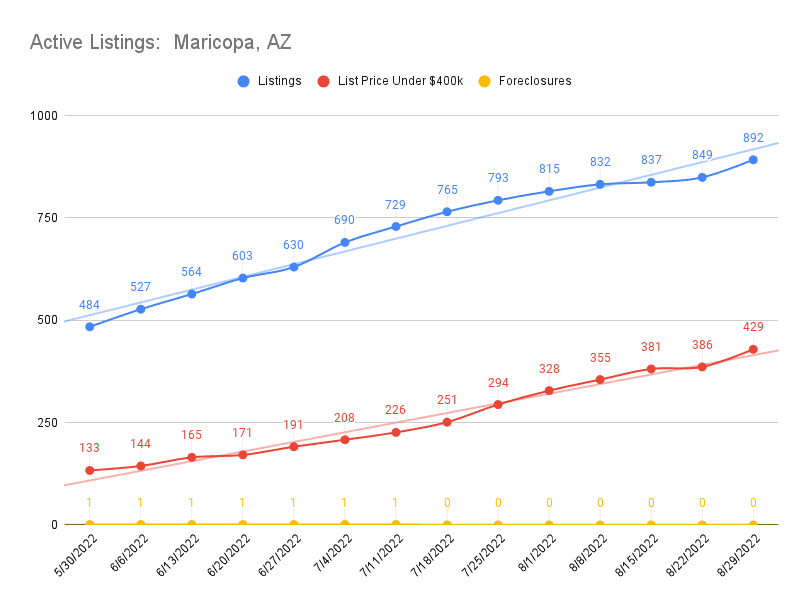
Maricopa Arizona Real Estate Inventory
(Data Source: Realtor.com 5/30/2020 – 8/29/2022)
Inventory levels have been on the rise in Maricopa. The overall rate of increase has slowed in the past couple of weeks, but the rate of increase in inventory under $400,000 has ticked up.
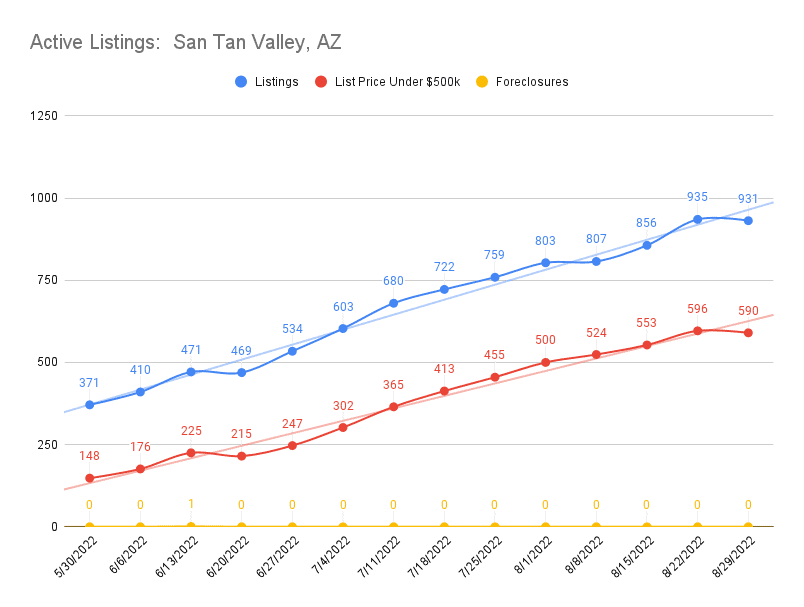
San Tan Valley Arizona Real Estate Inventory
(Data Source: Realtor.com 5/30/2020 – 8/29/2022)
Inventory levels ticked down this week in San Tan Valley. Is this the start of a new trend or just a blip. Check back next week to find out.
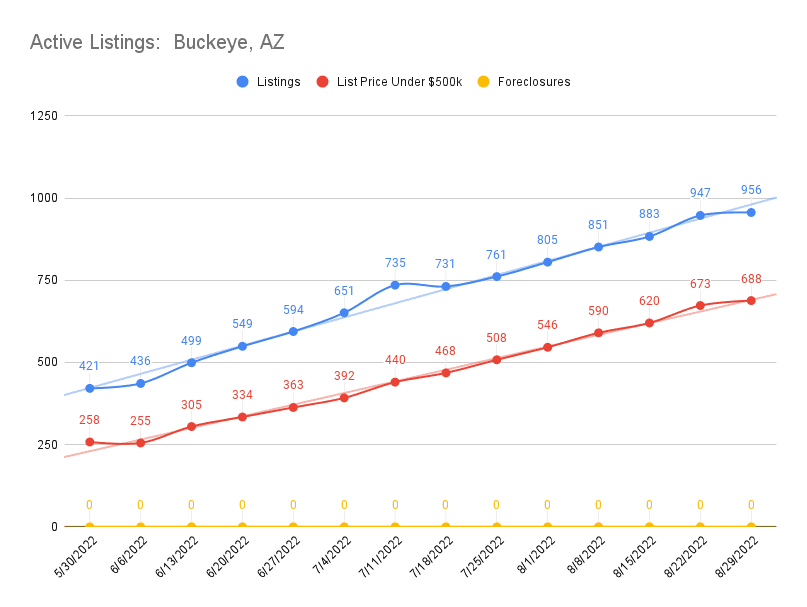
Buckeye Arizona Real Estate Inventory
(Data Source: Realtor.com 5/30/2020 – 8/29/2022)
Inventory rates also ticked down a bit in Buckeye, AZ this week.
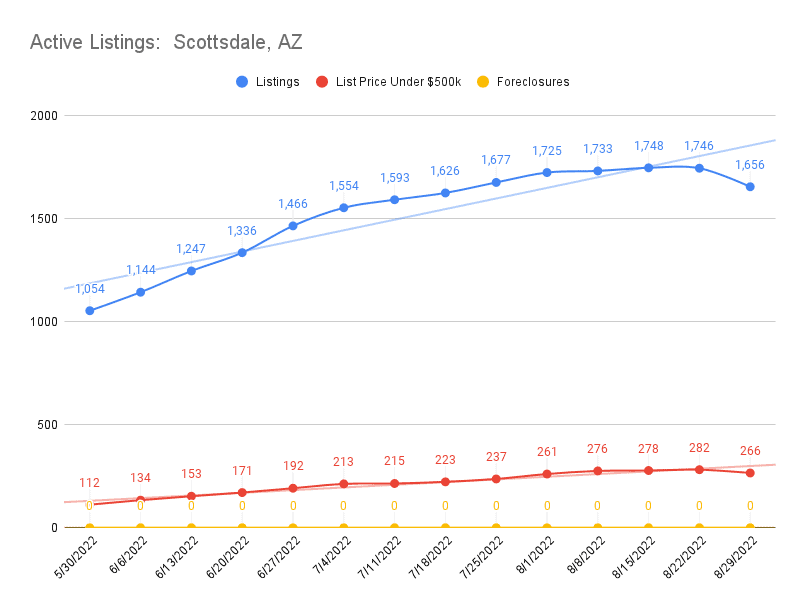
Scottsdale Arizona Real Estate Inventory
(Data Source: Realtor.com 5/30/2020 – 8/29/2022)
Overall active listings are down in Scottsdale week over week by about 90 listings.
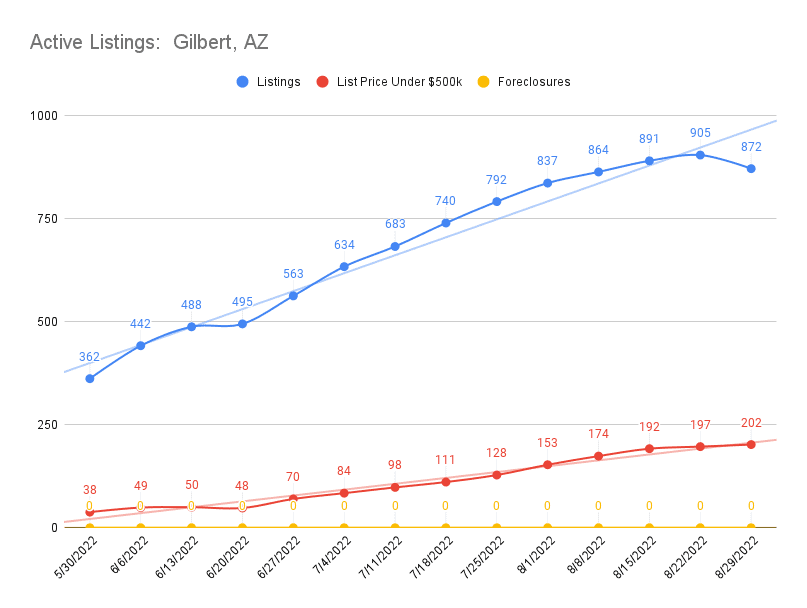
Gilbert Arizona Real Estate Inventory
(Data Source: Realtor.com 5/30/2020 – 8/29/2022)
Check out Gilbert. The overall inventory dropped week over week, but the inventory under $500,000 actually increased.
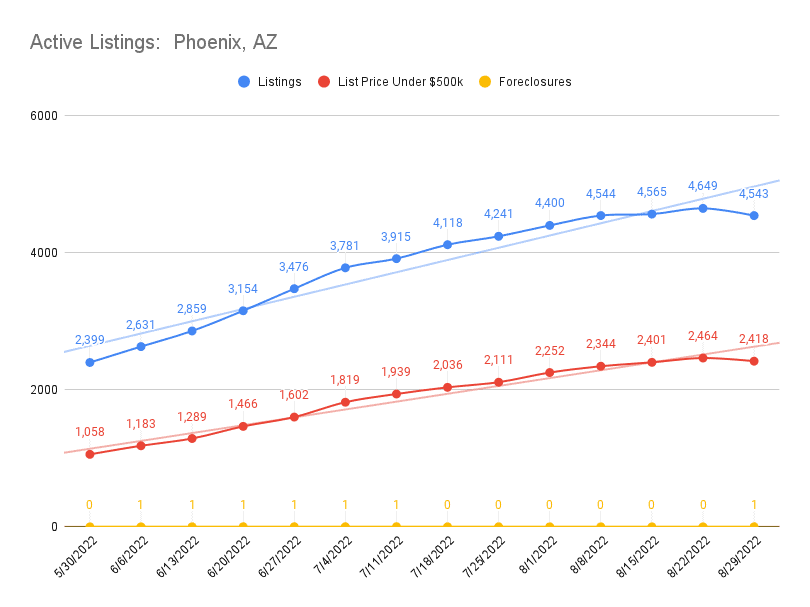
Phoenix Arizona Real Estate Inventory
(Data Source: Realtor.com 5/30/2020 – 8/29/2022)
Inventory in the City of Phoenix declined last week. But there are still very few foreclosures available. According to Realtor.com there was only 1 active foreclosure listing in City of Phoenix.
Thanks For Checking Out This Arizona Real Estate Market Data
If you made it this far, maybe you love geeking out on Arizona real estate market data. It’s great to have you here! Be sure to bookmark this page so that you can see the latest data weekly. And please leave a comment so that we can hear what’s going on in your neighborhood.
Author:
Reid Johnson
Owner, Clickapro
Reid is a licensed Real Estate Agent in Arizona. Reid’s employing broker is Phoenix View Realty.
Get The Latest Updates
Subscribe To Our Weekly Newsletter
Be first to hear about new services and tips for your home.


The Phoenix real estate market seems like it might be on the rise again. Gotta keep watchin the numbers to see where 2023 takes us.
Great site with helpful info! Thanks for sharing!
Thank you!
Thanks!